Understanding Unit Economics for D2C Brands in India
The Complete Financial Blueprint — From Pricing and COGS to Cash Flow and Profitability — For Founders at Every Stage
Here is a story that plays out every month in India’s D2C space. A founder launches a brand. Orders start coming in, revenue grows and the Instagram ads are working. The team celebrates, but then the bank balance tells a different story. Money is going out faster than it comes in. The brand looks healthy on the surface. Underneath, the economics are broken. The Unit economics for D2C brands is a complex problem that needs to be kept in check right from the get go. Or it kills more D2C brands than bad products, weak marketing, or tough competition.
Unit economics is the financial DNA of your business. It answers one question: does every single order you fulfil move you closer to profit — or further away from it? Our previous guide on CAC vs LTV covered the two most important acquisition and retention metrics. This guide goes wider and deeper.
We cover the full financial picture — from the cost of making your product to the cash sitting in your bank account. We walk through pricing, gross margins, hidden costs, working capital, and the cash conversion cycle. And we include a practical pre-launch economics checklist for founders who are still in the ideation stage. If you are building a D2C brand in India — or thinking about it — this is the financial blueprint you need before you spend your first rupee.
What Are Unit Economics — and Why Most Founders Get Them Wrong
Unit economics for D2C is the profit or loss generated by a single unit of your business. That unit can be one product sold, one order fulfilled, or one customer acquired. The concept is simple. But most D2C founders in India get it wrong for three reasons:
- They confuse revenue with profit. Revenue is what comes in. Unit economics tells you what stays after every cost is deducted. A brand doing Rs 50 lakh a month in revenue can still be losing Rs 5 lakh a month if the economics are wrong.
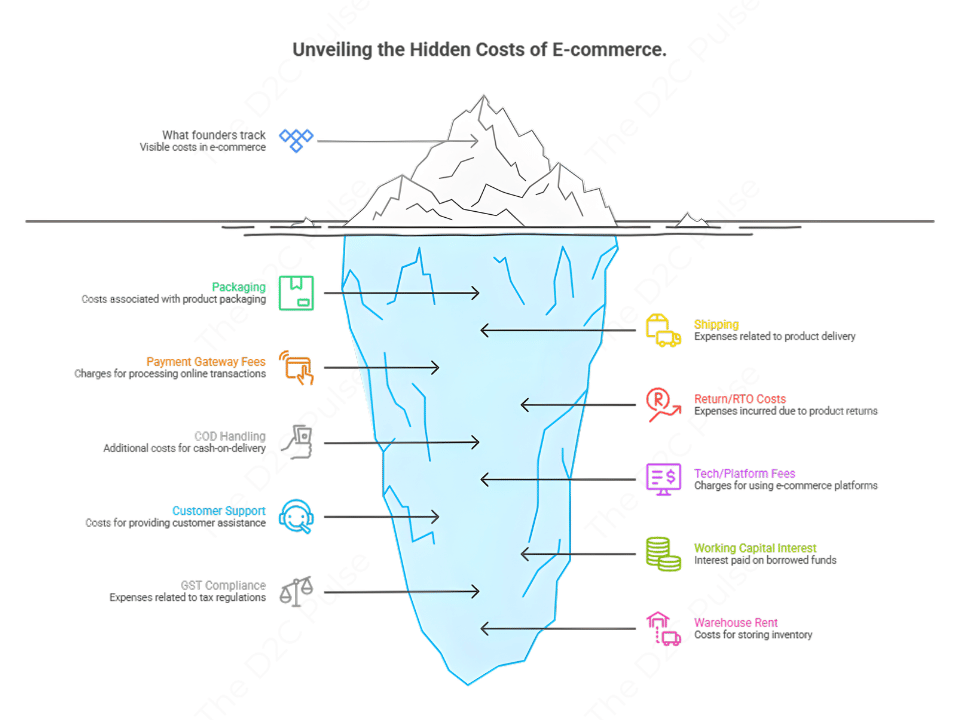
- They measure too few costs. Most founders track COGS and ad spend. They forget packaging, payment gateway fees, return handling, warehousing, and the cost of cash-on-delivery failures. These hidden costs can eat 15–25% of revenue.
- They measure too late. The Unit economics for D2C your brand should be modelled before you launch. Not after you have burned through your first few lakhs discovering that your price point cannot support your cost structure.
Unit economics is not accounting. It is strategic intelligence. It tells you what you can afford to spend on marketing, how to price your products, when to scale, and when to stop. Every decision a D2C founder makes should start with the unit economics.
[Internal link: Read CAC vs LTV: The Unit Economics Deep Dive for D2C Brands for the acquisition and retention lens]
The Full Cost Stack: Every Rupee That Leaves Your Business on Every Order
Most blogs about D2C unit economics talk about CAC and LTV. We covered those in depth in our previous guide. This section covers what comes before CAC and LTV — the cost of actually making, packaging, shipping, and collecting payment for your product. Here is the complete cost stack for a single D2C order in India:
1. Cost of Goods Sold (COGS)
COGS is the direct cost of producing or procuring one unit of your product. One of the highests costs for any Unit economics for D2C brands. For a skincare brand, it includes raw materials, formulation, filling, and labelling. On the other hand, for a fashion brand, it includes fabric, cutting, stitching, and finishing. For a contract-manufactured product, it is the per-unit price your manufacturer charges.
A healthy COGS target for D2C brands in India is 25–40% of the selling price. This gives enough room for everything else. If your COGS exceeds 50%, you will struggle to build a profitable business unless your AOV is very high.
2. Packaging Costs
This is often underestimated part of Unit economics for D2C brands. The D2C packaging is not just a box. It includes the inner packaging (product wrap, bubble wrap, inserts), the outer shipper box, branded tape, thank-you cards, and any promotional inserts. For brands that invest in the unboxing experience, packaging can cost Rs 30–80 per order. On a Rs 500 product, that is 6–16% of revenue — a meaningful number.
3. Shipping and Logistics
Last-mile delivery in India costs Rs 50–100 per order for standard shipments through 3PL partners like Delhivery, Shiprocket, or XpressBees. Heavier products and remote PIN codes cost more. If free shipping is offered, the cost comes directly from the margin and messes up the Unit economics for D2C brands. If you charge the customer, it can reduce conversion rates.
4. Payment Gateway Fees
Every online payment has a processing fee. Razorpay, Cashfree, and PayU charge 1.5–2.5% per transaction depending on the payment method. UPI transactions are the cheapest while credit card transactions cost the most. On a Rs 1,000 order, this is Rs 15–25 — small per order, significant at scale.
5. Return and RTO Costs
This is the silent margin killer and also the most difficult to calculate in the Unit economics for D2C brands. When a customer returns a product or a cash-on-delivery order goes undelivered (RTO), you pay for forward shipping, reverse shipping, and product damage or repackaging. The product may not be resalable. In fashion, return rates can reach 20–25%. In beauty and electronics, they are lower at 5–10%. But even a 10% return rate on 1,000 orders means 100 orders that cost you money with zero revenue.
6. COD Handling Costs
Cash-on-delivery still accounts for 45–46% of D2C orders in India. COD orders have two extra costs: a COD fee charged by the logistics partner (Rs 15–30 per order), and a higher return rate because the customer has not paid upfront. The effective cost of a COD order is always higher than a prepaid order. Smart brands track unit economics separately for prepaid and COD.
7. Platform and Technology Fees
Shopify charges a monthly subscription plus transaction fees. Other tools in your stack — email marketing, CRM, analytics, WhatsApp automation — all have costs. At early stage, these are relatively small. At scale, they add up fast and disrupt the Unit economics for D2C brands. The typical technology cost for a D2C brand is 2–5% of revenue.
We strive to bring the best deals for Ecommerce owners and provide discounts on D2C Tech Stacks. Checkout our offers here.
8. Customer Support
Handling queries, complaints, exchange requests, and refund processing all have a cost. Whether you do it in-house or outsource, customer support typically costs Rs 10–30 per order at scale. This is a cost that founders rarely model before launch in their Unit economics for D2C brands, but it grows directly with order volume.
There are a few other costs that depend highly on the kind of domain you’re in or the type of brand you’re trying to build. But we are focusing here on the most important and obvious ones.
Most D2C founders model COGS and ad spend. They forget packaging, payment fees, return costs, COD handling, tech fees, and support costs. Together, these hidden costs can consume 15–25% of revenue. If you do not account for them, your margins are an illusion.
The Unit Economics for D2C P&L: A Rupee-by-Rupee Walkthrough
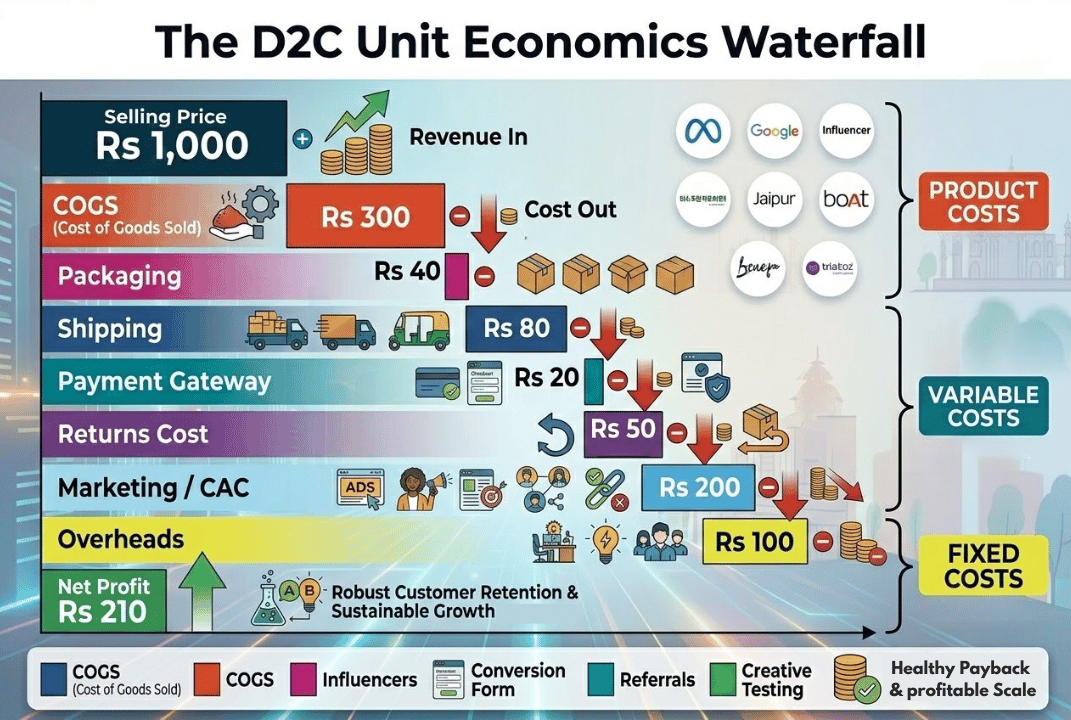
Let us build a complete unit economics P&L for a D2C order. We will use a personal care brand selling a product at Rs 1,000 as our example.
| Line Item | Amount (Rs) | % of Selling Price |
| Selling Price (MRP) | 1,000 | 100% |
| Less: GST (18% inclusive) | – 153 | 15.3% |
| Net Revenue | 847 | 84.7% |
| Less: COGS (raw materials + manufacturing) | – 280 | 28% |
| Gross Profit | 567 | 56.7% |
| Less: Packaging | – 45 | 4.5% |
| Less: Shipping (free shipping to customer) | – 75 | 7.5% |
| Less: Payment gateway fee (2%) | – 20 | 2% |
| Less: Return/RTO cost (10% rate, blended) | – 30 | 3% |
| Less: COD handling (blended across prepaid/COD) | – 12 | 1.2% |
| Less: Customer support | – 15 | 1.5% |
| Less: Technology/platform fees | – 20 | 2% |
| Contribution Margin 1 (CM1) | 350 | 35% |
| Less: Marketing & CAC (performance ads) | – 180 | 18% |
| Contribution Margin 2 (CM2) | 170 | 17% |
| Less: Indirect marketing (brand, content, SEO) | – 50 | 5% |
| Contribution Margin 3 (CM3) | 120 | 12% |
This is the anatomy of Unit economics for D2C order. From a Rs 1,000 selling price, only Rs 120 — 12% — remains as contribution margin after all variable costs. That Rs 120 must cover fixed costs (team salaries, office, legal, accounting) and eventually generate profit. Now you see why pricing, COGS control, and operational efficiency matter so much. A 5% improvement at any layer compounds across thousands of orders.
CM1 tells you if your product and operations are viable. CM2 tells you if your growth engine works. CM3 tells you if the whole business model is sustainable. Most investors in 2025 screen for positive CM2 as a minimum before writing a cheque.
Gross Margin Benchmarks by D2C Category in India
Gross margin — what you keep after COGS — is the starting line, everything else is built on top of it. If your gross margin is too thin, no amount of marketing genius or operational efficiency will save the business. Here are realistic gross margin ranges for Indian D2C brands in 2025:
| Category | Gross Margin Range | Key Margin Drivers |
| Beauty & Skincare | 60–80% | Low COGS on formulations. Premium pricing. High repeat potential. |
| Personal Care | 50–70% | Moderate COGS. Volume-driven. Price capped by mass-market alternatives. |
| Fashion & Apparel | 55–70% | High markup offset by high returns (20–25%). Inventory risk. |
| Food & Beverages | 35–55% | Lower margins. Shelf life and cold chain add cost. Price sensitive. |
| Electronics & Audio | 30–50% | Component costs high. Price competition intense. Volume matters. |
| Health & Wellness | 55–75% | Strong margins on supplements. Trust barrier means higher CAC. |
| Home & Furniture | 40–60% | High AOV helps. Shipping cost high for bulky items. Low return rate. |
| Jewellery | 50–70% | Design premium. Raw material cost varies with metal prices. |
As a rule of thumb: aim for 60%+ gross margin if you are in a competitive D2C category with high marketing costs. Anything below 40% makes profitability extremely difficult in a D2C-first model unless your AOV is above Rs 2,000 or your repeat rates are exceptionally strong. This is the foundation of Unit economics for D2C Bands.
[Internal link: Read The Complete D2C Ecosystem in India, Explained for how every cost layer connects]
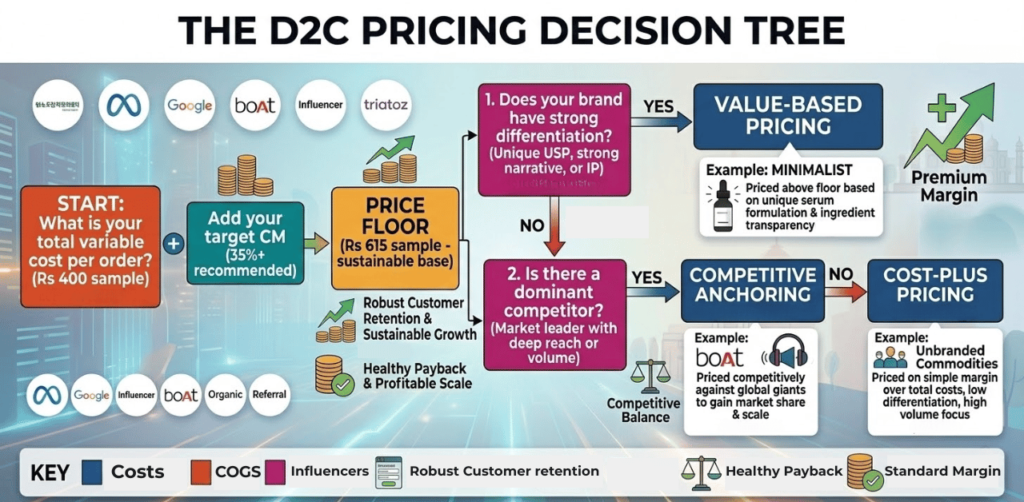
Pricing Strategy: The Decision That Shapes All Your Economics
Pricing is the single most important unit economics decision. It sets the ceiling for every other number in Unit economics for D2C brand. Price too low, and no amount of cost cutting will make the business work. Price too high, and you limit your addressable market and invite competitors. There are three pricing approaches Indian D2C founders should understand:
Cost-Plus Pricing
Start with your total variable cost per order (COGS + packaging + shipping + payment fees + return handling). Add your target contribution margin. That gives you the minimum viable price. If a brand’s total variable cost per order is Rs 450 and it wants a 35% CM1, the minimum selling price needs to be around Rs 690. Most early-stage founders should start here to avoid the trap of pricing below their cost floor.
Value-Based Pricing
Price based on what the customer perceives the product is worth — not what it costs you to make. Minimalist prices its serums at Rs 500–700 for a 30ml bottle. The COGS is a fraction of that. But the perceived value — backed by ingredient transparency, clinical claims, and educational content — justifies the price. Value-based pricing works when you have a differentiated product and strong brand narrative.
Competitive Anchoring
Price relative to a reference point the customer already knows. If the leading traditional brand charges Rs 400 for a similar product, a D2C brand might price at Rs 500 with a “premium but worth it” positioning, or at Rs 350 with a “same quality, direct price” positioning. The key is to know what you are anchoring against and why.
The worst pricing mistake in Indian D2C? Racing to the bottom. Low prices attract deal-hunters who never come back. They destroy your margin structure. And they signal low quality in the customer’s mind. Price for value, not for volume. Volume follows value.
The Cash Conversion Cycle: The Number Nobody Talks About
This is the section you will not find in most Unit Economics for D2C guides. And it is the one that catches founders off guard the hardest. The cash conversion cycle (CCC) measures how long your money is tied up between paying for inventory and receiving cash from a customer’s order. In simpler terms: how many days pass between the money going out and the money coming back in?
Here is how it works for a typical Indian D2C brand:
| Component | Typical Days (India D2C) |
| Inventory Days (purchase to stock) | 30–45 days |
| Time in warehouse before order | 15–30 days |
| Delivery to customer | 3–7 days |
| Payment settlement (prepaid) | 2–3 days |
| Payment settlement (COD) | 10–14 days |
| Supplier payment terms | –30 days (credit) |
| Typical CCC for Indian D2C brand | 45–70 days |
This means your cash is locked up for 45–70 days on every inventory cycle. If you are doing Rs 10 lakh in monthly sales, you might need Rs 15–23 lakh in working capital just to keep the cycle running. For a bootstrapped founder, this is the difference between survival and shutdown.
Revenue is a number on a dashboard. Cash is what pays your suppliers, your 3PL partner, and your rent. A D2C brand can be profitable on paper and still die because cash arrived two weeks too late. Model your CCC before you launch.
The Pre-Launch Economics Checklist: 12 Questions Every Founder Must Answer Before Spending a Rupee
This section is written for founders who are in the ideation stage or preparing to launch their first D2C brand. If you can answer these 12 questions with real numbers — not guesses — you are ready. If you cannot, you need to do more homework before you spend money.
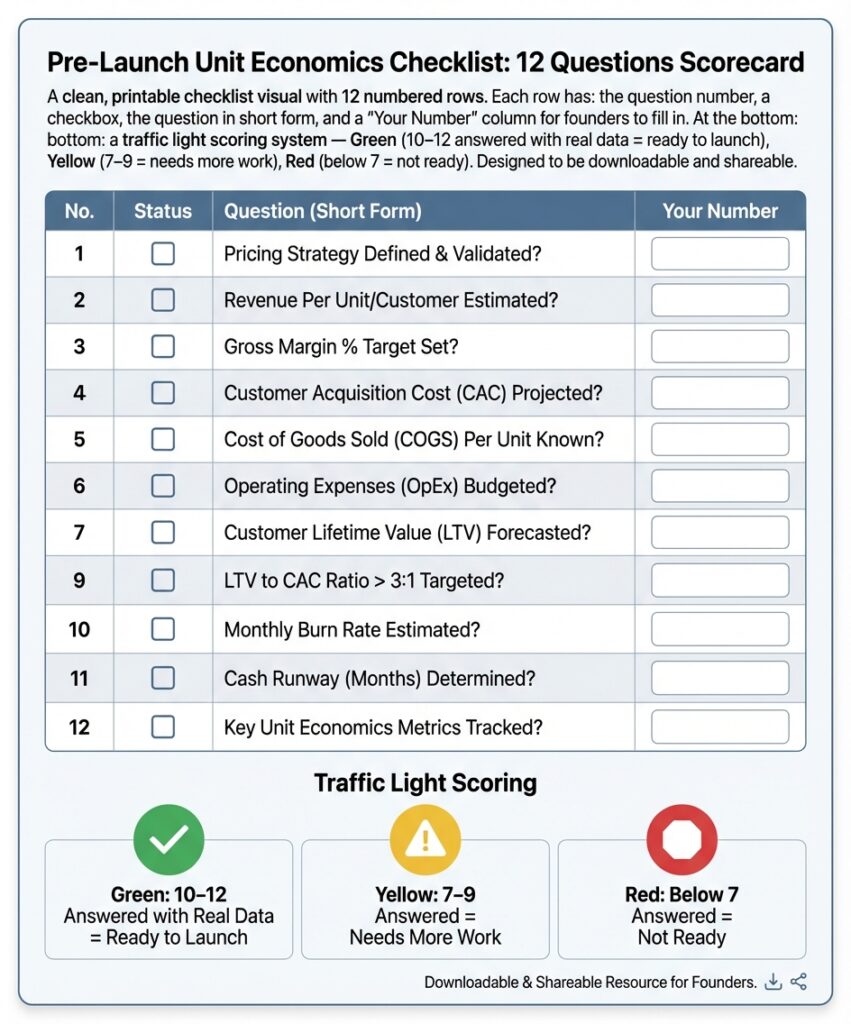
[Internal link: Read in detail – Pre-Launch Economics Checklist]
Seven Unit Economics Traps That Catch Indian D2C Founders
Even founders who understand unit economics for D2C in theory fall into these traps in practice:
Trap 1: Celebrating ROAS While Losing Money
A brand reports 3x return on ad spend. The team celebrates. But ROAS only measures revenue against ad spend. It does not include COGS, shipping, returns, packaging, or payment fees. After all costs, that 3x ROAS might leave Rs 52 profit on a Rs 1,000 order. One small increase in ad costs, and the brand is underwater. Always measure contribution margin, not ROAS, as your true profitability metric.
Trap 2: Free Shipping as Default
Free shipping feels good for the customer. But it shifts Rs 50–100 per order from the customer to the brand. For low-AOV products (under Rs 500), free shipping can consume 10–20% of the selling price. The fix: set a minimum order value for free shipping. This increases AOV and protects margins simultaneously.
Trap 3: Ignoring COD Economics
COD customers have higher return rates, slower cash settlement, and additional handling fees. Yet most brands calculate one blended unit economics number. The result: they overestimate profitability. Track prepaid and COD economics separately. Use WhatsApp nudges to convert COD to prepaid after order placement — this alone can cut return rates by 10–20%.
Trap 4: Scaling Before CM2 Is Positive
The most dangerous trap when it comes to The unit economics for D2C Brands. A brand raises funding and immediately scales marketing spend. But if CM2 (contribution margin after marketing) is negative, every new order loses money. Scaling a negative-CM2 business means scaling your losses. Fix the economics first. Then scale. This is the single most common reason Indian D2C brands burn through funding and shut down.
Trap 5: Underestimating Inventory Cash Lock-Up
A fashion brand buys three months of inventory based on optimistic forecasts. It sells only 60% in the first month. The rest sits in the warehouse, tying up cash. Eventually, the unsold inventory must be discounted, destroying the margin it was supposed to generate. For early-stage brands, start with smaller batches. Test demand before committing to large production runs.
Trap 6: Discounting to Drive First Orders
Heavy launch discounts (30–50% off) attract customers who will never pay full price. They inflate CAC, depress AOV, and create a customer base that only buys on sale. The brand then becomes dependent on discounting, which permanently erodes margins. A better approach: use trial sizes, sample kits, or a small welcome discount (10–15%) that brings people in without destroying price perception.
Trap 7: Not Tracking Unit Economics by SKU
A brand might have 20 products. Five are profitable. Ten break even. Five lose money. But if you only track blended unit economics, you never see this. The loss-making SKUs drag down the overall margin while consuming inventory capital and warehouse space. Track CM2 for each SKU individually. Double down on winners, fix or discontinue the losers. For many, this alone can fix the The unit economics for D2C.
Many D2C brands discover too late that their best-selling campaigns were also their least profitable ones. The product with the most orders might be the product losing the most money per order. SKU-level unit economics is the only way to know.
[Internal link: Read D2C vs Marketplace vs Omnichannel: Which Model Wins in India? for how channel choice impacts unit economics]
If You Have Not Launched Yet: Unit Economics Tips for Ideation-Stage Founders
The best time to get unit economics for D2C brand right is before you spend a single rupee.
- Run the numbers before you build the brand. Get three manufacturer quotes. Get logistics rate cards. Price out packaging. Build a simple spreadsheet with the P&L waterfall we showed earlier. If the numbers do not work on paper, they will not work in reality.
- Choose a category where gross margins support the unit economics for D2C. Beauty and skincare (60–80% gross margins) are structurally easier than food and beverages (35–55%). This does not mean food cannot work — but you need higher volume or subscriptions to make the economics viable.
- Design your product for repeat purchase. A consumable product (skincare, supplements, snacks, coffee) naturally drives repeat orders. A durable product (furniture, electronics) does not. If your product is a one-time buy, your first-order economics must be profitable on their own.
- Start with one hero SKU. Every SKU adds inventory cost, packaging complexity, and warehouse space. Launch with one product that has strong economics. Prove it works and then expand.
- Plan for 60–90 days of working capital. Do not just budget for inventory and ads when calculating the unit economics for D2C. Budget for the cash gap between spending and receiving.
- Test demand before committing to inventory. Run a landing page with a “coming soon” sign-up. Run a small batch of ads to a pre-order page. If 100 people are willing to pay before you have stock, you have validated demand.
- Price for margin, not for marketplaces. If you plan to sell on your own website AND marketplaces, remember that Amazon charges 15–30% commission. If your D2C price is Rs 800 and Amazon takes 20%. Your pricing must work at that net level.
- Talk to five D2C founders in your category before launching. Nobody publishes their real unit economics for D2C, but founders talk to other founders. Have five honest conversations about COGS, CAC, return rates, and what they wish they knew before launching.
The gap between a D2C idea and a D2C business is a spreadsheet. Not a website, not a logo, not an Instagram page. A spreadsheet that shows whether the numbers work. Build that first.
[Internal link: Read How D2C is Different from Traditional Retail in India to understand why the cost structure is unique]
The 10 Unit Economics Metrics Every D2C Brand Must Track Monthly
Here is the minimum set of metrics every D2C brand in India should track every month in order to get their unit economics for D2C in order. Not quarterly, not yearly, But Monthly.
| Metric | Formula | Healthy Benchmark |
| Gross Margin | (Revenue – COGS) ÷ Revenue | 40–70% depending on category |
| CM1 | Gross Profit – Fulfilment Costs | 30–45% |
| CM2 | CM1 – Direct Marketing | 15–25% (positive is essential) |
| CM3 | CM2 – Indirect Marketing | 10–20% |
| AOV | Total Revenue ÷ Total Orders | Category dependent. Higher = better. |
| Return Rate | Returned Orders ÷ Total Orders | Under 10% ideal. Under 15% acceptable. |
| Prepaid % | Prepaid Orders ÷ Total Orders | Above 55% good. Above 70% excellent. |
| CAC Payback | CAC ÷ CM1 per Order | Under 3 months ideal. Under 6 acceptable. |
| CCC | Inventory Days + Receivable Days – Payable Days | Under 60 days good. Under 45 excellent. |
| Burn Rate | Monthly Cash Outflow – Monthly Cash Inflow | Decreasing trend. Path to zero. |
Track these in a simple spreadsheet or dashboard. Review them on the first of every month. When a metric moves in the wrong direction, investigate immediately. Do not wait for the quarter-end to discover your margins have eroded.
Key Takeaways
Track 10 metrics monthly. Gross margin, CM1, CM2, CM3, AOV, return rate, prepaid percentage, CAC payback, CCC, and burn rate. Monthly. Non-negotiable.
Unit economics is the financial DNA of your D2C brand. It decides whether every order moves you closer to profit or further from it. Model it before you launch, not after.
The full cost stack goes far beyond COGS and ads. Packaging, payment fees, return handling, COD costs, tech fees, and customer support together consume 15–25% of revenue. Account for all of them.
CM1, CM2, and CM3 are the three layers of truth. CM1 = product viability. CM2 = growth engine viability. CM3 = business model viability. Track all three.
Pricing is the most important unit economics decision. Price for value and margin, not for volume. Low prices attract deal-hunters and destroy margin structures.
The cash conversion cycle kills brands that look profitable. Your CCC in India can be 45–70 days. Plan working capital for 60–90 days before launch. Cash is survival.
Ideation-stage founders must answer 12 questions with real numbers before spending their first rupee. Get manufacturer quotes, logistics rates, and packaging costs. If the spreadsheet does not work, the business will not either.
Frequently Asked Questions
Latest posts
- Marmeto, India’s First Shopify Premier Partner, Pivots From Services to Product-First Technology Company
- L’Oréal in Talks to Acquire D2C Beauty Startup Innovist
- Anveshan and the Rs 1,000 Crore Farm-to-Fork Valuation Leap
- Assiduus Global Raises $25 Million to Scale AI-Powered Middleware for Cross-Border D2C Commerce
- The Budget Split That Separates Brands That Scale from Brands That Stall