CAC vs LTV: The Unit Economics Deep Dive Every D2C Brand Needs
How to Measure, Benchmark, and Fix the Two Numbers That Decide Whether Your D2C Brand Survives or Scales
Two numbers decide whether a D2C brand lives or dies. The first is how much it costs to get a new customer for the products that you’re selling. The second is how much that customer is worth over time. These two numbers — Customer Acquisition Cost (CAC) and Customer Lifetime Value (LTV) — are the foundation of D2C unit economics. Get them right, and you build a profitable, scalable brand. Get them wrong, and you burn cash until the money runs out. This guide is a complete deep dive into CAC vs LTV for D2C brands.
Most D2C founders in India know these terms. Few measure them correctly. Fewer still act on what the numbers say. We cover what they are, how to calculate them, what good looks like, what breaks them, and how to fix them. With real Indian brand examples and practical frameworks you can use today.
Why CAC vs LTV Is the Most Important Equation in D2C
D2C looks simple on the surface. Make a product, build a website, run some ads, ship orders and you have a business. But underneath, every D2C brand is a maths problem. And the maths comes down to one question: does each customer generate more value than it costs to acquire them? If yes, you have a business. If no, you have a fundraising exercise.
This matters more than ever in 2026. D2C funding in India dropped to 757 million dollars in 2024 from 930 million in 2023 and 2025 was even slower. Investors no longer reward revenue growth alone. They want to see contribution margin discipline, which means they are looking for a healthy CAC vs LTV ratio. They want proof that unit economics work before they write a cheque. The brands that survive the funding winter are the ones that mastered this equation early. The ones that did not are the ones shutting down. Roughly 90% of D2C startups close by their fifth year and a bad unit economics is the most common reason.
Revenue is vanity, Profit is sanity. But the CAC vs LTV ratio is the truth. It tells you whether your business model actually works — or whether you are just moving money around.
What Is Customer Acquisition Cost (CAC)?
CAC is the total cost of getting one new customer to make their first purchase and the formula is simple:
CAC = Total Acquisition Spend ÷ Number of New Customers Acquired
But most brands calculate it wrong. They only count ad spend. Real CAC includes everything you spend to bring a new customer through the door:
- Paid advertising: Meta ads, Google ads, marketplace ads, YouTube ads.
- Influencer and creator fees: Payments to influencers, affiliate commissions, creator partnerships.
- Discounts and offers: First-purchase discounts, welcome coupons, free shipping offers that reduce revenue from the first order.
- Content and SEO costs: The team, tools, and time spent creating content that attracts organic traffic.
- Sales and marketing team salaries: The people running campaigns, managing channels, and optimising spend.
When you include all of this, your real CAC is almost always higher than you think.
CAC Benchmarks for Indian D2C Brands
CAC varies widely by category, channel, and stage. Here are rough benchmarks (based on our understanding) for Indian D2C brands in 2025:
| Category | Typical CAC Range | Why |
| Beauty & Personal Care | Rs 300–800 | High competition. Many brands bidding on same audience. |
| Fashion & Apparel | Rs 400–1,000 | High return rates. Need to factor RTO into effective CAC. |
| Food & Beverages | Rs 150–500 | Lower price points and Impulse purchase behaviour helps. |
| Electronics & Audio | Rs 200–600 | Strong search intent. Google captures high-intent buyers. |
| Health & Wellness | Rs 500–1,200 | High trust barrier. Needs more education before conversion. |
| Home & Furniture | Rs 800–2,000 | High AOV but long consideration cycle. Expensive to convert. |
These are averages. Your actual CAC depends on your brand strength, creative quality, channel mix, and how well your website converts. A strong brand with high organic traffic can have a CAC 50–70% lower than a brand that relies only on paid ads.
[Internal link: Read Customer Acquisition Strategies for D2C Brands in India for the full playbook]
What Is Customer Lifetime Value (LTV)?
LTV is the total revenue (or profit) a customer generates over their entire relationship with your brand. The basic formula:
LTV = Average Order Value × Purchase Frequency × Customer Lifespan
Let us make this concrete. Say a skincare brand has these numbers:
- Average Order Value (AOV): Rs 800
- Purchase frequency: 4 times per year
- Average customer lifespan: 2 years
LTV = Rs 800 × 4 × 2 = Rs 6,400
That means each customer is worth Rs 6,400 in revenue over their lifetime. If the brand’s CAC is Rs 600, the CAC vs LTV is in an excellent position with LTV-to-CAC ratio roughly coming to 10.7x. But if the same brand has a CAC of Rs 2,000 and customers only buy once (LTV = Rs 800), the ratio is 0.4x. This means that the brand is losing money on every customer.
The Three Levers That Drive LTV
LTV is not a fixed number. You can improve it by pulling three levers:
- Average Order Value (AOV): Get customers to spend more per order. Bundles, upsells, cross-sells, minimum-order-for-free-shipping thresholds — all of these push AOV up.
- Purchase Frequency: Get customers to buy more often. Subscription models, loyalty programs, reorder reminders on WhatsApp, new product launches, and seasonal campaigns all drive repeat purchases.
- Customer Lifespan: Keep customers longer by enhancing service, excellent post-purchase experience, and community building extend the relationship.
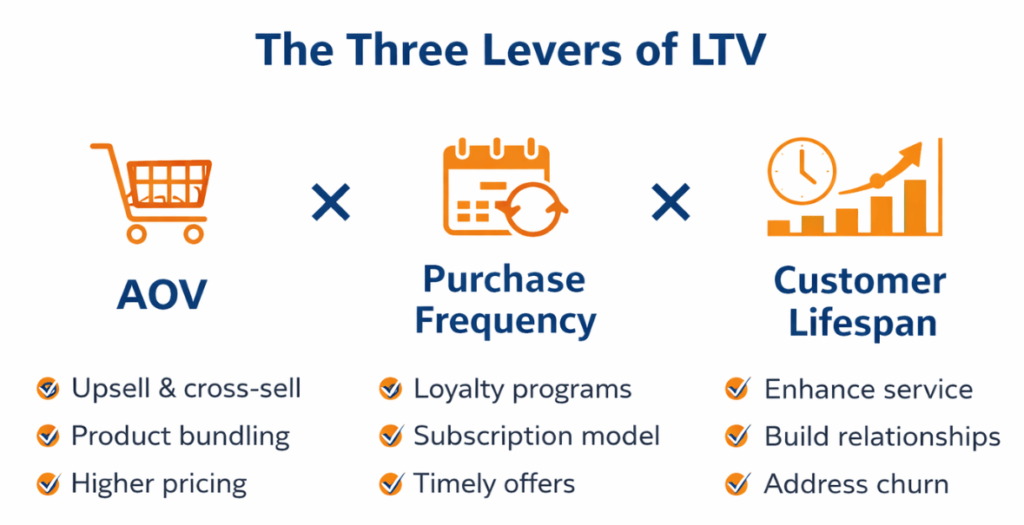
LTV is not destiny. It is a design choice. Every product decision, every email flow, every loyalty program, every WhatsApp message either increases or decreases your LTV. The best D2C brands engineer their LTV deliberately.
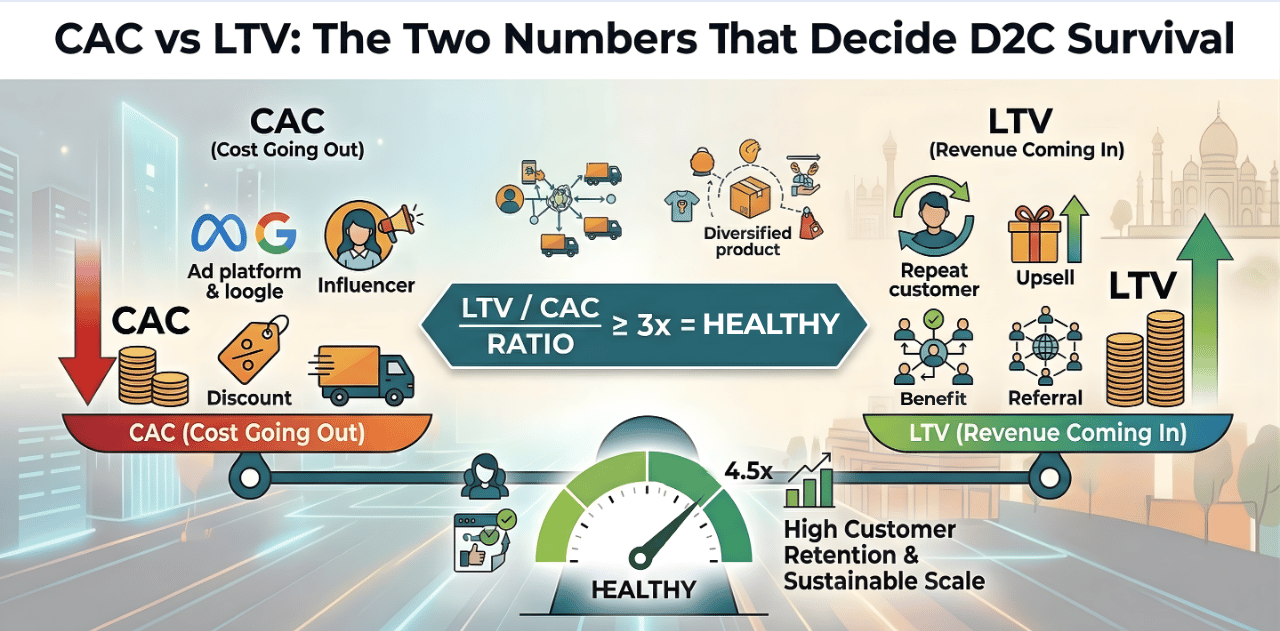
The CAC vs LTV Ratio: What Good Looks Like
The ratio is simple: LTV ÷ CAC. It tells you how many rupees of value you create for every rupee you spend on acquisition.
Here is how to read it:
| CAC vs LTV Ratio | What It Means | Action Required |
| Below 1:1 | You lose money on every customer. The business is not viable at current economics. | Stop spending on acquisition. Fix the product, pricing, or retention first. |
| 1:1 to 2:1 | You barely break even. No room for fixed costs, team, or growth. | Reduce CAC aggressively. Improve retention. Increase AOV. |
| 3:1 (Healthy) | The baseline for a sustainable D2C business. Enough margin to cover operations and reinvest. | Maintain and optimise. This is the minimum target. |
| 4:1 to 5:1 | Strong economics. The brand is efficient at both acquisition and retention. | Scale. Invest more in growth. You have earned the right to spend. |
| Above 5:1 | Excellent — but you might be under-investing in growth. | Test higher spend levels. You may be leaving market share on the table. |
The 3:1 ratio is the widely accepted benchmark. It means for every Rs 1 you spend acquiring a customer, you get Rs 3 back in lifetime value. That leaves enough margin for product costs, operations, team, and profit. Most struggling D2C brands in India operate at 1.5:1 to 2:1 ratio for LTV:CAC. They grow revenue but never reach profitability. The economics do not work.
What Breaks the CAC vs LTV Ratio in Indian D2C
The ratio breaks when CAC rises faster than LTV. In India, several forces are pushing this in the wrong direction:
CAC Is Rising
- Ad costs keep climbing. Meta and Google CPMs have risen roughly 30% year-on-year in competitive D2C categories. The same ad budget buys fewer customers every quarter.
- iOS privacy changes added friction. Apple’s App Tracking Transparency made ad targeting less precise. Brands report 20–25% higher CAC as a result.
- Market saturation. India has over 800 D2C brands. In popular categories like beauty and personal care, dozens of brands bid for the same audience. More competition means higher prices.
- Discount dependency. Many brands use heavy discounts to drive first purchases. This inflates CAC (the discount is a cost) and attracts deal-hunters who never come back.
LTV Is Under Pressure
- Low repeat rates. Many Indian D2C brands struggle to get customers to buy a second time. Without repeat purchases, LTV collapses to a single order.
- High return rates. RTO (return-to-origin) rates run 15–25% in categories like fashion. Every return is a cost with zero revenue. It destroys effective LTV.
- COD cash flow drag. Cash-on-delivery orders delay revenue and increase failed deliveries. The effective LTV of a COD customer is lower than a prepaid customer.
- Price sensitivity. India’s per-capita beauty spend is roughly $14 — far below China or the US. This structurally caps AOV and limits how high LTV can go without strong retention.
The brands that fail are not the ones with high CAC. They are the ones with high CAC and low LTV. The ratio is what matters. Fix the ratio, and you fix the business.
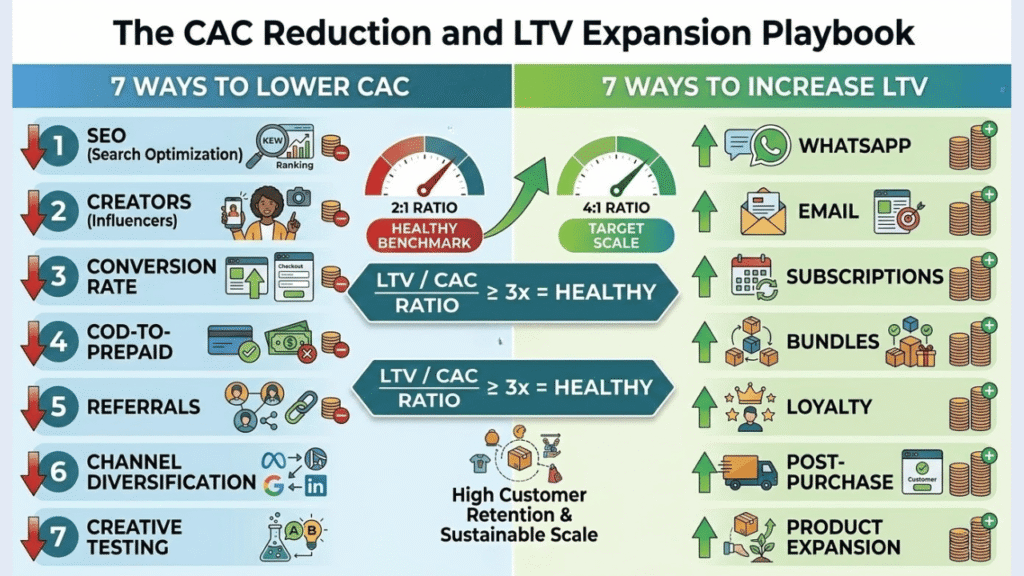
Seven Practical Ways to Lower CAC for Indian D2C Brands
- Invest in SEO and content. Organic traffic has zero marginal acquisition cost. Brands that rank for category keywords (“best vitamin C serum”, “ergonomic office chair”) acquire customers without paying per click. This is the single most effective long-term CAC reducer.
- Build a creator and influencer engine. Creator partnerships deliver 30–40% lower cost-per-lead than traditional ads. Micro-influencers with niche audiences convert better than celebrities. And user-generated content can be repurposed across paid channels.
- Optimise your website conversion rate. A 1% increase in conversion rate can lower CAC by 20–30%. Faster page loads, clearer product pages, trust signals (reviews, badges), and a frictionless checkout all help. UPI-first checkout reduces payment drop-offs.
- Convert COD to prepaid. COD orders have higher RTO and lower effective value. Use WhatsApp nudges to convert COD orders to prepaid after placement. This alone can cut return rates by 10–20% and improve effective CAC.
- Build referral loops. Referred customers cost almost nothing to acquire and typically have higher LTV than ad-acquired customers. A simple “give Rs 100, get Rs 100” referral program can meaningfully lower blended CAC.
- Diversify channels. Brands that reduce Meta/Google dependency to under 50% of their acquisition mix show 23% better unit economics. Add email, WhatsApp, affiliate marketing, and marketplace presence to the mix.
- Improve creative and targeting. Better ad creative means higher click-through rates and lower cost per click. Test constantly. A/B test headlines, images, offers, and landing pages. The brands that test most win on CAC.
[Internal link: Read Customer Acquisition Strategies for D2C Brands in India for the full playbook]
Seven Practical Ways to Increase LTV for Indian D2C Brands
- Build WhatsApp retention loops. WhatsApp has the highest open rates of any channel in India. Use it for reorder reminders, delivery updates, product tips, flash sale alerts, and post-purchase check-ins. This is the single most powerful LTV driver in the Indian D2C context.
- Launch email automation flows. Welcome series. Abandoned cart recovery. Post-purchase follow-up. Winback campaigns for lapsed customers. Email marketing delivers an average 3600% ROI. Tools like Klaviyo and WebEngage make this simple.
- Create subscription models. Subscriptions lock in recurring revenue. Country Delight’s daily milk delivery. The Whole Truth’s snack box. Subscription customers have near-zero CAC on repeat orders and dramatically higher LTV.
- Increase AOV through bundles and upsells. Offer product bundles at a slight discount to individual items. Add cross-sell recommendations at checkout. Set a minimum-order-value for free shipping. A 10% increase in AOV can double profitability if CAC stays constant.
- Launch a loyalty program. Points, VIP tiers, early access, birthday rewards — loyalty programs give customers a reason to come back. The key is making the rewards meaningful without destroying margin.
- Invest in the post-purchase experience. Branded packaging. A thank-you card in the box. A follow-up message asking for feedback. A quick resolution when something goes wrong. These small touches build emotional loyalty that no ad can create.
- Expand your product line strategically. New products give existing customers a reason to buy again. Minimalist started with serums, then expanded to sunscreens, cleansers, and body care. Each new product increased the LTV of existing customers.
🖼 IMAGE PLACEHOLDER Title: The CAC Reduction and LTV Expansion Playbook Description: A two-column visual. LEFT column (blue): 7 ways to lower CAC — listed as short labels with icons (SEO, creators, conversion rate, COD-to-prepaid, referrals, channel diversification, creative testing). RIGHT column (green): 7 ways to increase LTV — listed as short labels with icons (WhatsApp, email, subscriptions, bundles, loyalty, post-purchase, product expansion). Centre shows the ratio improving from 2:1 to 4:1 with an upward arrow. Suggested dimensions: 1200 x 700 px (landscape) Alt text: The CAC Reduction and LTV Expansion Playbook – D2C Intelligence Platform
[Internal link: Read Retention Marketing Strategies for D2C Brands for the complete framework]
Real Indian Brands: CAC vs LTV in Action
Country Delight — LTV-First by Design
Country Delight’s subscription model means customers pay daily for fresh milk delivery. CAC is high (app download + first delivery). But LTV is enormous — a customer who subscribes for two years generates tens of thousands in revenue. The CAC vs LTV ratio is among the best in Indian D2C. The entire model is designed to maximise lifetime value.
Minimalist — Science Builds Repeat Behaviour
Minimalist’s ingredient-transparency approach builds trust that drives repeat purchases. Customers who start with one serum often expand to three or four products. This organic product-line expansion increases both AOV and purchase frequency, pushing LTV higher without proportional increases in CAC. HUL’s acquisition of a 90% stake for over Rs 2,600 crore validated these economics.
boAt — Category Expansion Drives LTV
boAt started with earphones. Then added headphones, speakers, smartwatches, and cables. Each new product gave existing customers a reason to buy again. boAt’s LTV comes not from repeat purchases of the same product but from wallet share expansion across the audio and wearables category.
The Cautionary Tale — Brands That Got It Wrong
Several high-profile Indian D2C brands raised large funding rounds but could not fix their unit economics. They spent heavily on ads to acquire customers who bought once and never returned. Revenue grew, but so did losses. When funding dried up, these brands had no path to profitability. The CAC was high, the LTV was low and the ratio was below 2:1. That is not a business, that is a cash incinerator.
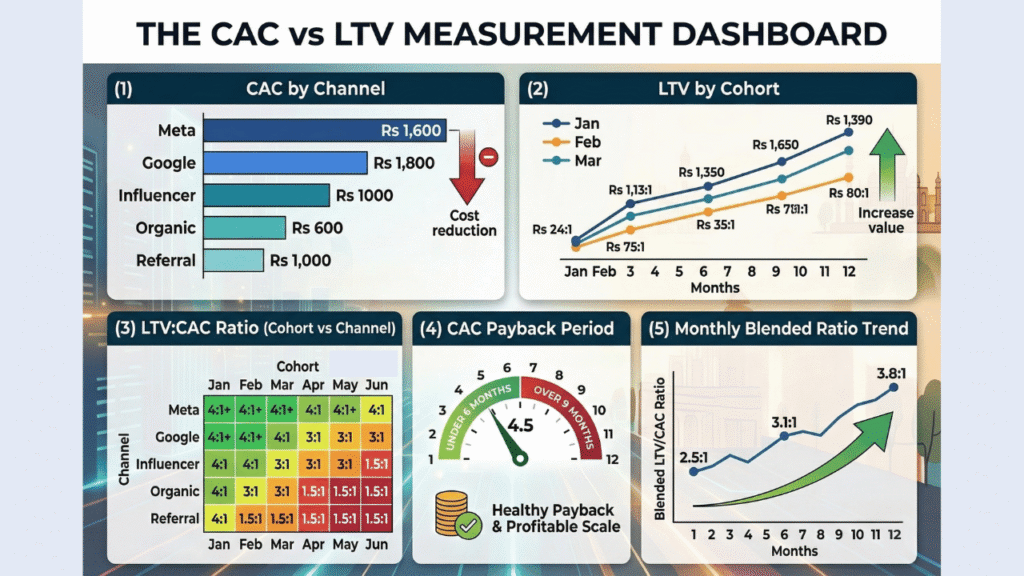
A Practical Framework: How to Track CAC vs LTV
Here is a simple framework any D2C brand can implement today:
Step 1: Calculate True CAC by Channel
Do not calculate one blended CAC, break it down by channel. Know your Meta CAC, Google CAC, influencer CAC, organic CAC, and referral CAC separately. This tells you where to spend more and where to pull back.
Step 2: Track LTV by Cohort
Group customers by the month they made their first purchase. Then track how much each cohort spends over 30, 60, 90, 180, and 365 days. This shows whether your retention is improving or declining over time.
Step 3: Compute the Ratio by Channel and Cohort
The ratio should be calculated at the intersection of channel and cohort. Customers acquired through Instagram in January may have a very different LTV from customers acquired through Google in March. This granularity is where the real insights live.
Step 4: Set a CAC Payback Period Target
CAC payback period is how long it takes for a customer’s cumulative purchases to cover their acquisition cost. A strong D2C brand should aim for a payback period under 6 months. Under 3 months is excellent. Over 12 months is dangerous.
Step 5: Review Monthly. Act Immediately.
This is not a quarterly exercise. Track CAC vs LTV monthly. When the ratio drops below 3:1 on any channel, investigate and fix. When a cohort shows strong retention, double down on whatever brought those customers in.
Beyond the CAC vs LTV Ratio: Contribution Margin Layers
Sophisticated D2C brands go deeper than just CAC and LTV. They track contribution margins in layers:
| Metric | Formula | What It Tells You |
| CM1 | Net Revenue – COGS | Product-level profitability. Is your product itself profitable? |
| CM2 | CM1 – Fulfilment + Logistics + Direct Marketing | Operational profitability. Are you profitable after shipping and ads? |
| CM3 | CM2 – Indirect Marketing | True contribution after all growth investments. This is what investors look at. |
The most important layer is CM2. If CM2 is negative, you are losing money on every order even before indirect costs. No amount of scale will fix a negative CM2. You need to either raise prices, lower COGS, reduce shipping costs, or lower CAC before you scale. Investors in 2026 screen for positive CM2 as a minimum. Brands with positive CM3 are the ones that attract serious capital.
[Internal link: Read Understanding Unit Economics for D2C Brands in India for the full framework]
Key Takeaways
Contribution margin layers (CM1, CM2, CM3) go deeper than the ratio. If CM2 is negative, do not scale. Fix the economics first.
CAC vs LTV are the two numbers that decide D2C survival. Master them or fail. There is no shortcut.
The minimum healthy ratio is 3:1 (LTV to CAC). Below this, unit economics do not work. Above 5:1, you may be under-investing in growth.
CAC is rising in India. Ad costs up 30% year-on-year, iOS privacy changes, market saturation, and discount dependency are all pushing CAC higher.
LTV is the bigger lever. It is easier to double LTV (through retention, AOV increases, and subscriptions) than to halve CAC. Focus on keeping customers, not just getting them.
Measure by channel and cohort, not just blended. Blended numbers hide problems. Track CAC vs LTV at the intersection of acquisition channel and customer cohort.
WhatsApp, email, SEO, and subscriptions are the four highest-ROI tools for improving the ratio in the Indian D2C context.
Frequently Asked Questions
Latest Posts
- Marmeto, India’s First Shopify Premier Partner, Pivots From Services to Product-First Technology Company
- L’Oréal in Talks to Acquire D2C Beauty Startup Innovist
- Anveshan and the Rs 1,000 Crore Farm-to-Fork Valuation Leap
- Assiduus Global Raises $25 Million to Scale AI-Powered Middleware for Cross-Border D2C Commerce
- The Budget Split That Separates Brands That Scale from Brands That Stall