Achieving Profitability in D2C: The Stage-by-Stage Playbook for Indian Brands
Why Most D2C Brands Stay Unprofitable. What the Profitable Ones Do Differently. And How to Think About Achieving Profitability at Every Stage of Growth.
Here is an uncomfortable truth about Indian D2C: of the roughly 11,000 D2C companies operating in India, a large majority have never posted a net profit. Many never will. The funding boom of 2020–2022 poured $3.4 billion into Indian D2C startups. It rewarded revenue growth, not profitability. Brands scaled to Rs 50 crore, Rs 100 crore, Rs 500 crore in revenue and still lost money on every order. When the funding dried up in 2023–2024, many of these brands hit a wall with no fresh capital and negative unit economics. No path to achieving profitability in D2C without a complete operational overhaul.
The landscape has changed now. Investors screen for positive CM2 before writing a cheque. Valuations have compressed from 10–15x revenue to 2–4x. Series A rounds now need $5–10 million in ARR, and growth rounds demand EBITDA positivity or a clear 12-month path to it.
But here is what gets lost in the doom talk: several Indian D2C brands have cracked profitability. What separates the profitable from the unprofitable is not luck. It is a set of operational decisions made at each stage of growth. Achieving profitability in D2C is not a single event, it is a progression. And how you think about it should change at every stage of your company.
This guide breaks it down, the seven profit levers and five stages of growth, each with a different profitability mandate. And also the common mistakes that keep brands stuck in the loss cycle.
Why Most Indian D2C Brands Stay Unprofitable
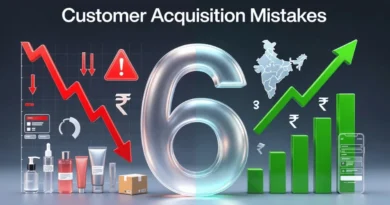
Before we talk about achieving profitability in D2C, we need to understand why so many brands fail at it. The reasons are surprisingly consistent.
The Discount Addiction
Many D2C brands acquire their first 10,000 customers through 30–50% discounts, flash sales, and launch offers. The customers arrive but the revenue looks good only on the dashboard. Companies realise later that most of these customers were buying the discount, not the brand. When prices normalise, they leave. The brand then discounts again to hit the next month’s target. This creates a loop: heavy discounting leads to low margins, which leads to a need for more volume, which leads to more discounting. Breaking out of this loop is hard while achieving profitability. The customer base has been trained to wait for sales.
CAC Inflation Without Retention Investment
Meta and Google ad costs in India have risen 30–40% year-on-year since 2022. A customer that cost Rs 300 to acquire in 2021 might cost Rs 500–700 today. This has become the biggest hurdle in achieving profitability for D2C companies. If your repeat purchase rate is below 25%, most of these customers never come back. You are spending Rs 500–700 to get one order worth Rs 800–1,200 in revenue. After COGS, shipping, returns, and the acquisition cost, there is nothing left. Achieving profitability in D2C becomes impossible when your CAC payback extends beyond 6 months.
Premature Scaling
This is the trap that killed the most funded D2C brands. A brand raises a Series A and the founder hires 30 people while renting a bigger office space. Launches 15 SKUs, opens a warehouse and starts Amazon ads along with influencer campaigns. Monthly burn jumps from Rs 10 lakh to Rs 80 lakh. Revenue grows, but contribution margin is still negative. Every new order loses money and scaling a negative-CM2 business just means you lose money faster. The fix is boring but essential: prove unit economics at small scale before scaling spend.
Ignoring the Full Cost Stack
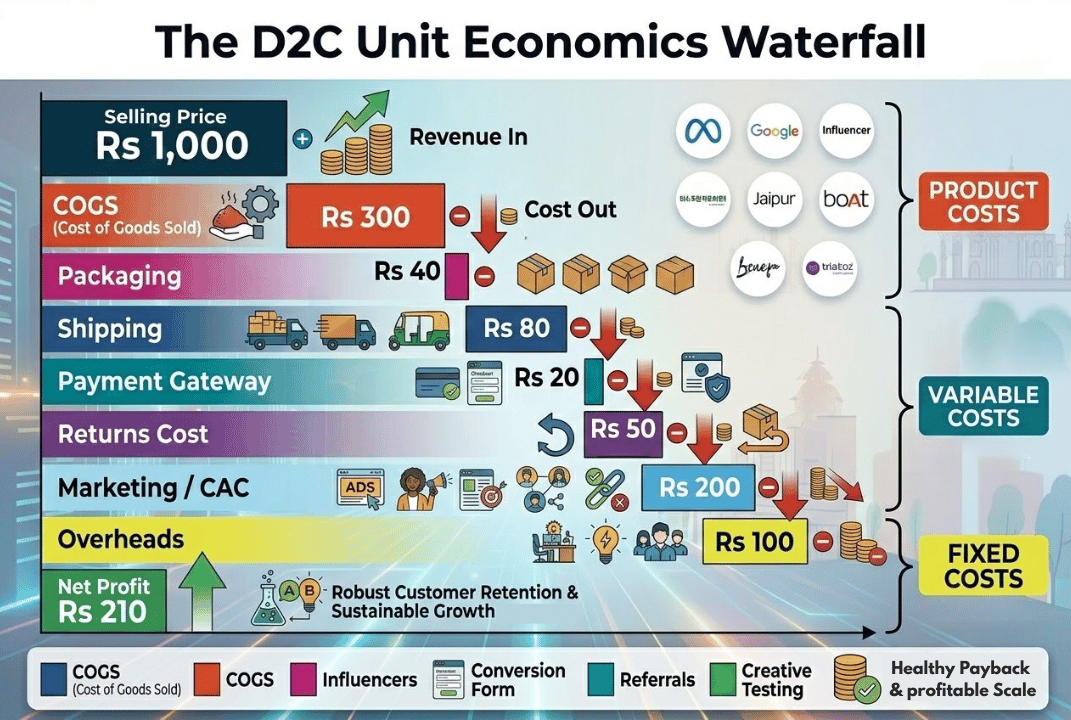
Most founders track COGS and ad spend. They ignore packaging (Rs 30–80 per order), payment gateway fees (1.5–2.5%), COD handling (Rs 15–30 extra per order), return costs (forward + reverse shipping + product write-off), customer support (Rs 10–30 per order), and technology stack costs (2–5% of revenue). On a Rs 1,000 order, these “hidden” costs can consume Rs 150–250. Founders who do not track the full cost stack overestimate their margins by 15–25 percentage points. Biggest setback in achieving profitability.
Also Read: Understanding Unit Economics for D2C Brands in India for the full 8-item cost stack breakdown
The Seven Profit Levers for Achieving Profitability in D2C
Every profitable D2C brand in India has pulled some combination of these seven levers. They are listed in order of impact.
Lever 1: Gross Margin Expansion
This is where profitability starts. Your gross margin (revenue minus COGS) is the raw material for everything else. If your gross margin is 35%, you have very little room after logistics, marketing, and operations. If it is 65%, you have a fighting chance towards achieving profitability.
How Indian D2C brands expand gross margin: Renegotiate manufacturer pricing at higher volumes. Bring manufacturing in-house (Minimalist built their own facility). Reformulate products to reduce ingredient costs without quality loss. Reduce packaging costs through standardisation. Eliminate low-margin SKUs and double down on high-margin heroes. boAt’s domestic manufacturing push (70%+ volumes made in India by FY25) reduced component costs and improved margins.
Lever 2: CAC Reduction
The second-biggest lever for achieving profitability. If you spend Rs 600 to acquire a customer and reduce it to Rs 400, that Rs 200 saving falls straight to contribution margin on every single new customer.
What works in India: Invest in SEO and organic content (zero marginal CAC once it ranks). Build WhatsApp flows for re-engagement (Rs 0.50–2 per message vs Rs 50–100 per paid click). Use micro-influencers over celebrities (30–40% lower CPL). Run Click-to-WhatsApp ads (25–40% lower CAC than landing page ads). Build referral loops. Repurpose creator content as shoppable video on PDPs. Diversify beyond Meta and Google.
Also Read: How to Reduce CAC for D2C Brands in India for the full 12-tactic playbook
Lever 3: Retention and LTV Growth
The single most underrated lever. A customer who buys three times is worth 3x a customer who buys once, but the acquisition cost was paid only once. Retention is where D2C profitability compounds.
The numbers: Acquiring a new customer costs 5–7x more than retaining an existing one. A 5% increase in retention can lift profit by 25–35%. Indian D2C brands with 30%+ repeat purchase rates are almost always CM2 positive. Brands below 15% repeat rate struggle in achieving profitability.
What works: Post-purchase WhatsApp flows (delivery updates, usage tips, reorder nudges). Email automation (5 core flows: welcome, abandoned cart, post-purchase, winback, replenishment). Loyalty programs with UPI cashback (87% of Indian consumers prefer cashback over points). Subscription models for consumables. Community building through regular communication and distribution of UGC helps in achieving profitability much faster.
Also Read: Retention Marketing Strategies for D2C Brands for the full framework
Lever 4: AOV Increase
Higher AOV means your fixed per-order costs (shipping, packaging, payment fees) become a smaller percentage of revenue. A Rs 1,500 order with Rs 75 shipping cost absorbs 5% in logistics. A Rs 500 order with the same Rs 75 cost absorbs 15%.
What works: Bundle pricing (kits and combos). Free shipping thresholds (set at Rs 799 or Rs 999). Upsell and cross-sell on checkout pages. Tiered pricing (good/better/best). Mini-cart recommendations. Gift sets during festivals. Every Rs 100 increase in AOV can improve CM1 by 3–5 percentage points.
Lever 5: Return and RTO Reduction
Returns are the silent margin killer. A returned order costs forward shipping + reverse shipping + repackaging + potential product write-off. In fashion D2C, return rates hit 20–25%. Even in beauty (5–10%), each return wipes out the profit of 2–3 successful orders.
What works: Better product photography and sizing guides (reduces “not what I expected” returns). WhatsApp order confirmation with COD-to-prepaid nudges (reduces RTO by 10–20%). AI-driven address verification and fraud detection. NDR (non-delivery report) management automation. Cash-on-delivery surcharge of Rs 49–99 (discourages low-intent orders).

Lever 6: Operational Efficiency
This lever gets ignored in favour of the “sexier” growth levers, but it compounds powerfully. boAt reduced its working capital cycle from 71 days in March 2024 to 36 days in March 2025. That freed up crores of rupees in cash.
What works: Consolidate 3PL partners and negotiate volume-based rates. Move to warehouses closer to your top-selling PIN codes (reduces delivery cost and transit time). Automate inventory planning to reduce dead stock. Negotiate better payment terms with suppliers. Track and reduce customer support cost per order. Move from monthly to weekly inventory review cycles and you’ll find the cash cycles helping towards achieving profitability.
Lever 7: Channel Mix Optimisation
Not all revenue is equal. A Rs 1,000 order on your own website has very different unit economics from a Rs 1,000 order on Amazon (15–30% commission) or quick commerce (30–40% commission). Brands that let marketplace revenue dominate their mix often find that total revenue grows while profitability declines.
The target: Aim for 40–60% of revenue from your own D2C website (highest margin). Use marketplaces for discovery and incremental volume. Use quick commerce selectively for high-margin, high-velocity SKUs. Track CM2 by channel, not just blended. Some brands discover that their fastest-growing channel is also their least profitable one.
Also Read: D2C vs Marketplace vs Omnichannel: Which Model Wins in India? for channel strategy
The Metrics That Actually Matter in Achieving Profitability
Revenue is vanity, Profit is sanity. Here are the metrics that separate profitable D2C brands from those that just look busy.
| Metric | Formula | Healthy Benchmark | What It Tells You |
| Gross Margin | (Revenue – COGS) ÷ Revenue | 60%+ for BPC, 55%+ for fashion, 40%+ for F&B | Can the product itself make money? |
| CM1 | Gross Profit – Fulfilment Costs | 35%+ of revenue | Are product + operations viable? |
| CM2 | CM1 – Direct Marketing Costs | 15%+ of revenue | Does the growth engine work? |
| CM3 | CM2 – Indirect Marketing | 10%+ of revenue | Is the full model sustainable? |
| EBITDA Margin | CM3 – Fixed Costs (team, rent, tech) | 5%+ positive | Is the company making money? |
| CAC Payback | CAC ÷ CM1 per Order | Under 3 months ideal. Under 6 acceptable. | How fast does a new customer pay for itself? |
| LTV:CAC Ratio | Customer Lifetime Value ÷ CAC | 3:1 minimum. 4:1–5:1 strong. | Is the business building long-term value? |
| Repeat Rate | Returning Customers ÷ Total Customers | 25%+ good. 35%+ excellent. | Is the brand earning loyalty? |
Investors in 2026 screen for positive CM2 as a minimum. Brands with CM3 above 10% and a clear path to EBITDA positivity within 12–18 months are the ones that attract capital. Revenue growth without margin discipline no longer works.
Achieving Profitability in D2C: The Five-Stage Framework
Here is the core of this article. How you think about profitability should change at every stage of your D2C company. Applying scale-stage thinking to a pre-launch brand is just as dangerous as applying launch-stage thinking to a Rs 100 crore brand.
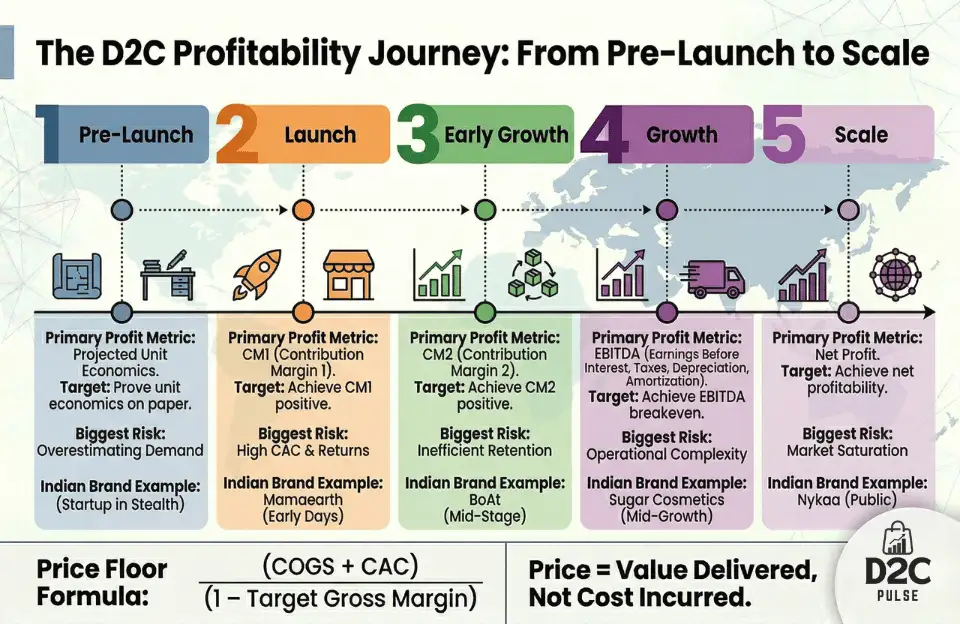
Stage 1: Pre-Launch. Prove Unit Economics on Paper Before Spending a Rupee.
Revenue: Rs 0
Profitability mandate: Prove that the numbers can work. Not that they do work—you have not sold anything yet—but that the model is structurally sound.
What to do: Get three manufacturer quotes. Get 3PL rate cards from Delhivery, Shiprocket, or XpressBees. Price out packaging (inner wrap + outer shipper + inserts). Model your full variable cost per order. Set your MRP with a target of 60%+ gross margin. Build a simple P&L waterfall in a spreadsheet to show how you’ll work towards achieving profitability. If the numbers show negative CM1 at any realistic price point, go back to the drawing board. Change the product, the manufacturing approach, or the category. Do not launch a business whose maths do not work on paper.
Acceptable losses: None. You should not be spending money yet. The only investment at this stage is time and research.
Red flags: Gross margin below 40%, i.e COGS > 60% of target selling price. No realistic path to CM1 positive.
Example: Mohit and Rahul Yadav spent 18 months researching formulations and manufacturers before launching Minimalist. They did not rush to market. They launched with a product whose margins could support the business.
Stage 2: Launch (Rs 0–25 Lakh Monthly Revenue). Get to CM1 Positive.
Revenue: Rs 0–25 lakh per month
Profitability mandate: Achieve CM1 positive on your hero SKU. CM1 = gross profit minus all fulfilment costs (packaging, shipping, payment fees, returns, COD handling, customer support, tech fees). If CM1 is positive, your product operations are viable. If it is negative, every order costs you money before you even start marketing.
What to do: Focus on one hero SKU and also track every cost line item per order. Optimise packaging costs, push hard for prepaid orders (WhatsApp nudges, small prepaid discounts), make do with a tiny team(2–4 people) and use free or low-cost tools as much as possible. Spend marketing budget carefully on testing, not scaling, Test 3–4 ad creatives and try to find the one that converts. Do not scale spend until you know which channel and creative combination delivers positive CM1 orders.
Acceptable losses: Losing money on overall EBITDA is fine. Fixed costs (your salary, tools, basic overhead) will exceed contribution margin at this revenue level. That is expected. What is not acceptable: negative CM1 per order. If every order loses money at the product level, scaling makes it worse.
Red flags: CM1 negative after 3 months of selling. Return rate above 15%. COD share above 60%. Blended CAC above your AOV.
Example: Country Delight launched with one product: milk. They proved the subscription model worked, proved the unit economics on daily delivery, and only then expanded to curd, paneer, and bread. First product, first proof.
Stage 3: Early Growth (Rs 25 Lakh–Rs 1 Crore Monthly Revenue). Get to CM2 Positive.
Revenue: Rs 25 lakh–Rs 1 crore per month
Profitability mandate: Achieve CM2 positive. CM2 = CM1 minus direct marketing spend (performance ads, influencer fees, marketplace commissions). CM2 positive means your growth engine works. You can acquire customers, fulfil orders, and still have margin left.
What to do: This is where you start investing in retention. Set up WhatsApp post-purchase flows. Build email automation (welcome series, abandoned cart, replenishment reminders). Create a referral programme. Start building organic traffic through SEO and content. The goal is to create a second source of customers beyond paid ads, so your blended CAC starts dropping. This will compound towards achieving profitability.
Launch your trial-size SKU if you have not already. Trial sizes at Rs 149–299 are your lowest-CAC acquisition tool. If 30% convert to full-size within 60 days, the trial pays for itself.
Begin tracking CM2 by channel (website vs Amazon vs Instagram shop) and by SKU. You will likely discover that 2–3 SKUs are carrying the profitability of the entire catalogue. Double down on those. Fix or kill the loss-makers.
Acceptable losses: EBITDA negative is still acceptable, because you are investing in brand building, content, and team. But CM2 must be positive and improving month-over-month.
Red flags: CM2 negative after 6 months at this stage. Repeat purchase rate below 15%. More than 70% of revenue coming from paid ads. Working capital cycle above 70 days.
Example: Mokobara hit CM2 positive within 18 months of launch by maintaining premium pricing (Rs 5,000–15,000 bags), keeping the SKU count tight, and building a brand-first approach that reduced reliance on performance marketing.
Stage 4: Growth (Rs 1–5 Crore Monthly Revenue). Get to EBITDA Breakeven.
Revenue: Rs 1–5 crore per month
Profitability mandate: Achieve EBITDA breakeven. This means CM3 (contribution margin after all marketing) covers your fixed costs: team salaries, office rent, technology stack, legal, accounting. The business is self-sustaining. It does not need external capital to survive.
What to do: This is the stage where operational efficiency becomes the primary profit lever. Renegotiate 3PL contracts at higher volumes. Consolidate warehousing. Automate inventory planning. Build a dedicated retention team. Shift marketing budget from 70% performance / 30% brand to 55% performance / 45% brand. Brand marketing reduces long-term CAC.
Start building your omnichannel presence selectively. Not 500 retail outlets. Maybe 3–5 experience stores or pop-ups in top cities. Or selective listings on Nykaa, Myntra, or Amazon with margin-protected pricing.
This is also where you need to professionalise your finance function. Monthly P&L reviews. SKU-level profitability tracking. Cash flow forecasting. Working capital management. Brands that wing their finances at this stage often discover they are technically insolvent despite growing revenue.
Acceptable losses: EBITDA can still be slightly negative if you are making deliberate investments (a new warehouse, a technology upgrade, an offline pilot). But the trajectory must be clearly toward breakeven. Investors at this stage expect a 12–18 month path to EBITDA positive.
Red flags: EBITDA margin worsening despite revenue growth. Team size growing faster than revenue. Marketing spend as percentage of revenue not declining. Cash runway below 6 months.
Example: boAt reached this stage around FY22–FY23. Revenue crossed Rs 3,000 crore, but profitability was negative (Rs 129 crore loss in FY23). The turnaround came through domestic manufacturing (70%+ Made in India), working capital reduction (71 days to 36 days), and disciplined cost management. By FY25, they posted Rs 60 crore net profit and Rs 142 crore EBITDA.
Stage 5: Scale (Rs 5 Crore+ Monthly Revenue). Achieve and Sustain Net Profitability.
Revenue: Rs 5 crore+ per month (Rs 60 Cr+ annual)
Profitability mandate: Achieve and sustain net profit. Not just contribution margin. Not just EBITDA. Net profit after interest, taxes, depreciation, and all one-time costs. The business makes actual money.
What to do: At this scale, the profitability game shifts from individual order economics to portfolio management. You are managing multiple SKUs, multiple channels, potentially multiple brands. The key moves: rationalise the SKU portfolio ruthlessly (cut the bottom 20% that contributes 3% of revenue and negative margin). Build private-label or in-house manufacturing for your highest-volume products. Create a subscription tier for your most loyal customers. Expand offline through asset-light models (FOFO—franchisee-owned, franchisee-operated—or distribution partnerships) rather than capital-heavy owned stores.
Build your brand moat. At this stage, brand is the competitive advantage. Funded competitors can copy your product and undercut your price. They cannot copy your brand trust, community, and customer loyalty. Invest 30–40% of marketing budget in brand. It is the insurance policy that keeps CAC from spiralling.
Think about exit paths. IPO requires 2–3 years of audited profitability. Strategic acquisition (like Minimalist to HUL) requires demonstrated margins and growth. Both paths require net profitability.
Red flags: Net margin declining despite revenue growth. Dependence on discounting to hit revenue targets. Single channel contributing more than 60% of revenue. Customer acquisition growing faster than customer retention.
Example: Lenskart reached Rs 6,652 crore revenue in FY25 with Rs 297 crore net profit. The profitability came from vertical integration (in-house lens manufacturing), scale economics (2,700+ stores), technology investment (virtual try-on, AI-driven inventory), and brand loyalty (68 lakh Gold members). They spent a decade building the infrastructure before profitability arrived.
The Five Stages at a Glance
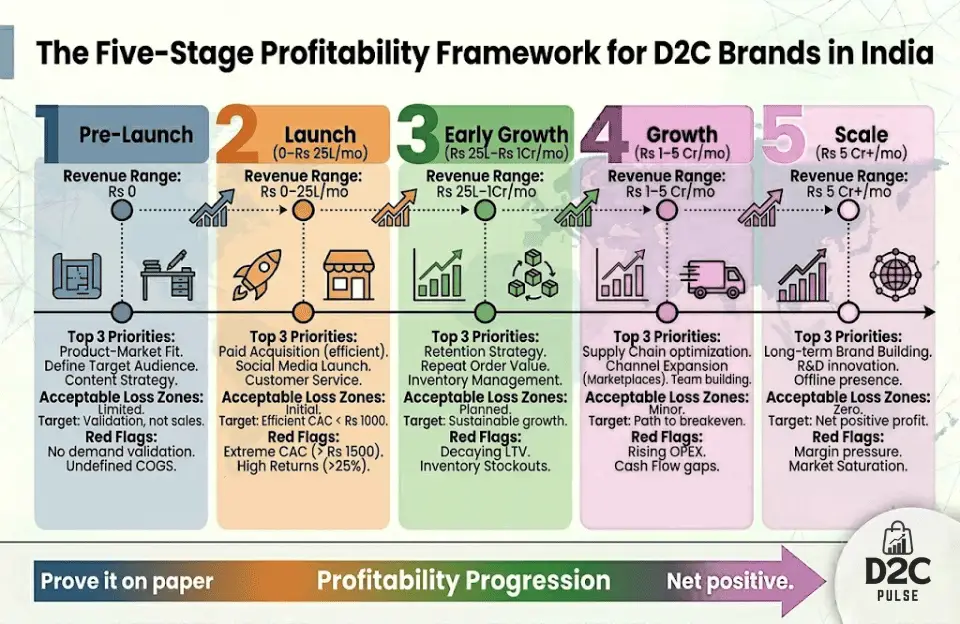
| Pre-Launch | Launch | Early Growth | Growth | Scale | |
| Revenue | Rs 0 | 0–25L/mo | 25L–1Cr/mo | 1–5Cr/mo | 5Cr+/mo |
| Profit Metric | P&L on paper | CM1 positive | CM2 positive | EBITDA breakeven | Net profit |
| Top Priority | Prove the maths | One hero SKU. Track every cost. | Build retention. Lower CAC. | Operational efficiency. Brand. | Portfolio management. Moat. |
| Loss OK? | No spend yet | EBITDA loss OK. CM1 loss NOT OK. | EBITDA loss OK. CM2 loss NOT OK. | Small EBITDA loss if deliberate. | No. Net profit required. |
| Timeline | 1–3 months | 3–6 months | 6–18 months | 18–36 months | 36+ months |
| Example | Minimalist (18mo research) | Country Delight (milk first) | Mokobara (CM2+ in 18mo) | boAt (FY23→FY25 turnaround) | Lenskart (Rs 297Cr profit) |
Indian D2C Profitability Scorecards: Who Got It Right
Here is how five Indian D2C brands achieved profitability, and the primary lever each one pulled.
| Brand | FY25 Revenue | FY25 Profit | Primary Lever | Time to Profit | Key Move |
| boAt | Rs 3,100 Cr | Rs 60 Cr net | Cost efficiency | 8 years (FY17→FY25) | 70% domestic manufacturing. WC 71→36 days. |
| Lenskart | Rs 6,652 Cr | Rs 297 Cr net | Vertical integration | 10+ years | In-house manufacturing. 2,700+ stores. |
| Minimalist | Rs 518 Cr | Profitable (pre-acquisition) | Margin discipline | 4 years (FY21→FY25) | In-house formulation. 60%+ gross margin. Controlled SKUs. |
| Mamaearth | Rs 2,067 Cr | Rs 73 Cr net | Scale + brand | 5 years (FY18→FY24 first profit) | House of 6 brands. 2.36L retail outlets. |
| Wakefit | Rs 1,000 Cr+ | EBITDA positive | D2C-first pricing | 6 years | Factory-to-consumer. No middleman markup. |
Also Read: The Performance vs Brand Marketing debate and which one is good for your D2C Brand
The Five Profitability Mistakes That Indian D2C Founders Keep Making
- Chasing revenue milestones instead of margin milestones. Hitting Rs 10 crore in revenue means nothing if CM2 is negative. A Rs 3 crore brand with 20% CM2 is healthier than a Rs 30 crore brand with negative CM2. Investors have learned this. Founders need to as well.
- Hiring ahead of revenue. A 5-person team at Rs 25 lakh monthly revenue has a fixed cost base of maybe Rs 5–8 lakh per month. Manageable. A 25-person team at the same revenue has Rs 20–30 lakh in fixed costs. Catastrophic. Hire only when the next hire directly unlocks revenue or reduces cost. Not because it feels professional to have a bigger team.
- Treating marketplace revenue as D2C revenue. Amazon revenue at 25% commission has fundamentally different economics than website revenue at 2% payment processing. Track CM2 by channel. A brand reporting Rs 2 crore monthly revenue that is 70% Amazon might have worse unit economics than a brand doing Rs 80 lakh entirely through its own site.
- Not building brand early enough. Performance marketing delivers measurable ROI today. Brand marketing delivers unmeasurable ROI over months. Founders default to performance because it feels safer. But brands that invest 0% in brand building by stage 3 find themselves on a paid-ads treadmill with no organic demand. By the time they start building brand, CAC has already spiralled.
- Raising capital to cover losses instead of to fund growth. There is a difference between raising money to invest in a warehouse, a manufacturing line, or a new market (productive capital) and raising money to cover monthly losses from bad unit economics (life support). The first creates value. The second delays death. Too many Indian D2C brands raised Series A and B rounds to fund operating losses, not operating leverage.
Key Takeaways from Achieving Profitability article
- Achieving profitability in D2C is not a single event. It is a five-stage progression: prove it on paper, achieve CM1 positive, achieve CM2 positive, reach EBITDA breakeven, sustain net profit. Each stage has a different mandate and different acceptable trade-offs.
- Seven levers drive D2C profitability: gross margin expansion, CAC reduction, retention and LTV growth, AOV increase, return/RTO reduction, operational efficiency, and channel mix optimisation. Most profitable brands have pulled 3–4 of these.
- CM2 is the metric that separates survivors from casualties. If CM2 is negative, every new customer costs you money. Do not scale until CM2 is positive. This is the single most common mistake in Indian D2C.
- The brands that achieved profitability—boAt, Lenskart, Minimalist, Mamaearth—all took different paths. But they shared common traits: margin discipline, operational efficiency, brand investment, and the willingness to fix economics before scaling.
- Early-stage founders should target CM1 positive within 3 months of launch and CM2 positive within 12–18 months. If you cannot reach these milestones, the problem is structural (product, pricing, or category), not a matter of needing more volume.
- 2026 rewards discipline, not scale. Investors want EBITDA positivity or a clear 12-month path to it. Revenue growth alone does not attract capital anymore. Build a profitable business first. The growth capital will follow.
Frequently Asked Questions about Achieving Profitability
How long does it take for a D2C brand in India to become profitable?
It depends on the category, pricing, and execution, but most successful Indian D2C brands reach CM2 positive within 12–18 months and EBITDA breakeven within 24–36 months. Net profitability typically takes 4–8 years. boAt took 8 years (FY17–FY25). Minimalist reached profitability in about 4 years. Lenskart took over 10 years. The timeline is less important than the trajectory: margins should be improving every quarter.
What is the most important profitability metric for D2C brands?
CM2 (Contribution Margin 2). It measures gross profit minus fulfilment costs minus direct marketing costs. If CM2 is positive, your growth engine works. If CM2 is negative, every new customer loses you money. Investors in 2026 treat positive CM2 as the minimum threshold for investment.
Can a D2C brand be profitable without raising venture capital?
Yes. Several Indian D2C brands have bootstrapped to profitability. Minimalist was bootstrapped for its first few years before raising venture capital and was profitable before HUL acquired it. The key is starting with high gross margins (60%+), keeping the team lean, growing through organic channels and retention rather than paid ads, and reinvesting profits into the business.
Why do D2C brands with high revenue still lose money?
Four common reasons: heavy discounting that destroys margins, high CAC with low repeat purchase rates, premature scaling of team and infrastructure before unit economics are positive, and over-reliance on marketplace channels that charge 15–30% commissions. Revenue growth without margin discipline is the most common path to D2C failure in India.
How should early-stage D2C founders think about profitability?
Start by proving unit economics on paper before spending any money. At launch, focus on getting CM1 positive on your hero SKU within 3 months. In early growth (Rs 25L–1Cr monthly revenue), target CM2 positive by investing in retention, organic channels, and referral loops. Do not scale marketing spend until CM2 is positive. Every rupee you spend while CM2 is negative digs the hole deeper.